how to identify top and bottom in share market
How to identify top and bottom in share market
Is it possible to identify top and bottom in share market or in any market.
Identifying the top and bottom in the stock market, also known as market timing, is a challenging task and even seasoned professionals struggle with it. It's important to note that attempting to time the market can be risky and often leads to losses. It's generally recommended to focus on long-term investing and a diversified portfolio rather than trying to time market peaks and troughs. However, if you still want to explore this area, here are some strategies and tools that traders and investors use to identify potential market tops and bottoms:
Technical Analysis:
a. Moving Averages: Some investors use moving averages, such as the 50-day and 200-day moving averages, to identify trends and potential reversal points.
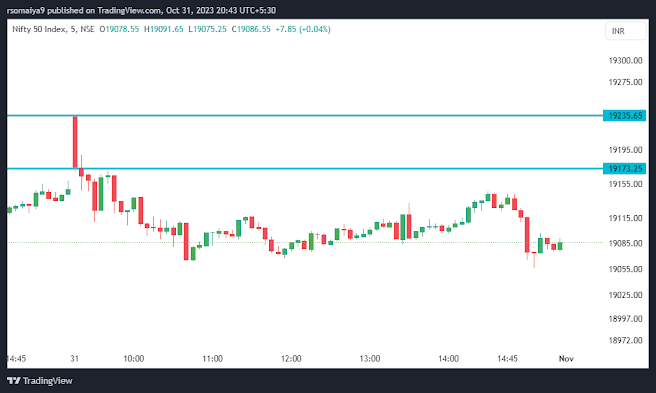
b. Support and Resistance Levels: Analyze historical price levels where the stock or market has previously found support (bottom) or resistance (top).
c. Chart Patterns: Study chart patterns like head and shoulders, double tops, and double bottoms to identify potential reversal points.
Fundamental Analysis:
a. Earnings Reports: Monitor a company's earnings reports to gauge its financial health and potential for growth. A significant change in earnings could influence stock prices.
b. Economic Indicators: Keep an eye on economic indicators like GDP, employment data, and inflation, as these can affect the overall market.
Sentiment Analysis:
a. Investor Sentiment: Watch for extreme optimism (a potential top) or extreme pessimism (a potential bottom) in market sentiment.
b. Contrarian Investing: Some investors use contrarian strategies, buying when others are overly pessimistic and selling when others are overly optimistic.
Technical Indicators:
a. Relative Strength Index (RSI): RSI measures the speed and change of price movements and is used to identify overbought or oversold conditions.
b. MACD (Moving Average Convergence Divergence): MACD can help identify changes in momentum and potential turning points.
Market News and Events:
a. Stay informed about market news, economic events, and geopolitical developments, as these can impact market sentiment and prices.
Risk Management:
a. Use stop-loss orders to limit potential losses if the market moves against your position.
b. Diversify your investments to spread risk across different assets.
Remember that identifying market tops and bottoms with precision is incredibly difficult, and it's often a game of probabilities. Even experienced traders can get it wrong. Market timing can lead to substantial losses, and it's not a recommended strategy for most long-term investors. Instead, focus on a well-diversified, long-term investment approach that aligns with your financial goals and risk tolerance. If you're unsure about your investment decisions, consider consulting with a financial advisor.

Comments
Post a Comment