Posts

Showing posts from October, 2023

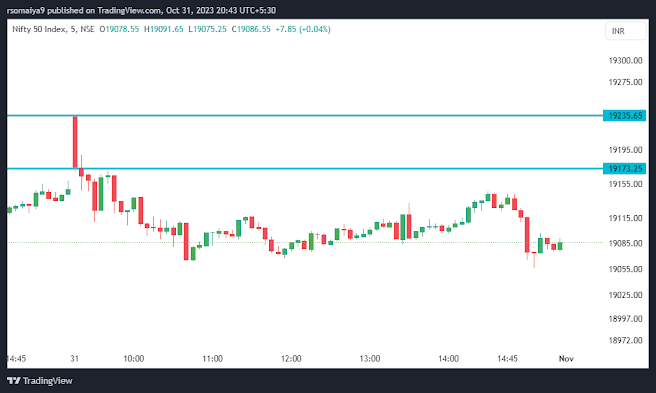
SPINNING TOP CANDLE IN NIFTY SPOT CHART

Image
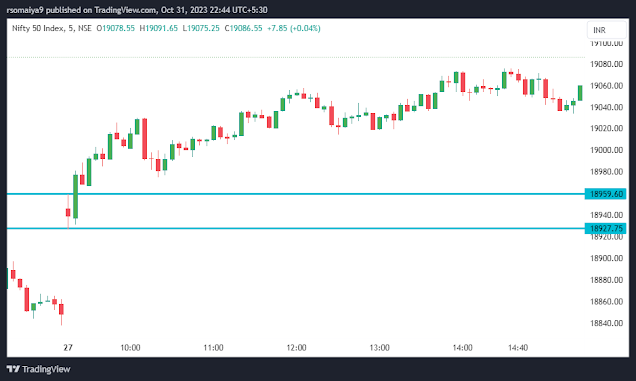
 SPINNING TOP CANDLE WHAT IS SPINNING TOP CANDLE AND WHAT TO DO WHEN YOU SEE THIS CANDLE.  HERE IN THIS ARTICLE WE WILL SHARE DETAILS OF SPINNING TOP CANDLE ON NIFTY SPOT CHART, THIS WILL HELP US IN BUYING OPTIONS. A spinning top candle is a specific type of candlestick pattern that can appear on a financial chart, especially in the context of stock market analysis. This pattern is characterized by its shape, which resembles a spinning top. In financial chart analysis, a spinning top candlestick has the following features: Shape: It has a small body with upper and lower wicks, indicating that the opening and closing prices were close together. Size: The body of the candle is smaller compared to the length of the wicks. Upper and Lower Wicks: The candlestick will have visible wicks (shadows) both above and below the body. These represent the highest and lowest prices reached during the trading period. The interpretation of a spinning top candle can vary based on the context in ...

"NIFTY FAKE BREAKDOWN" REAL EXAMPLE

Image
 WHAT IS FAKE BREAK DOWN IN OPTION BUYING WHERE IT OCCURS AND HOW IT OCCURS Support and Resistance Levels:  Fluctuations around key support or resistance levels that initially indicate a breakdown but may not sustain. Market Manipulation:  Instances where market actors may attempt to deceive traders by creating false breakdown patterns. Whipsaw Movement:  Rapid price movements that falsely suggest a trend reversal, often leading to sudden reversals. Liquidity Issues:  Temporary lack of liquidity causing price movements that might resemble a breakdown but later revert. Market Sentiment:  Sudden shifts in market sentiment causing apparent breakdowns that don't continue. Option Expiry:  False breakdowns close to option expiry dates used to manipulate options prices. Technical Indicators:  Misleading signals from technical indicators like RSI, MACD, or Moving Averages, indicating a breakdown that fails to materialize. News or Events:  Immediate m...

Best "Nifty option strategies" For buying "Intraday Nifty options"

Image
 "Nifty option strategies" As you all know, we are here to discuss about nifty option buying. we focus on buying option and not selling. option selling is considered is safe trade buy its very costly and required big capital to trade.  but for option buying, the capital required is very less, and if you practice hard then there are good chances to succeed in nifty option buying too. Its said 9 out of 10 buyers loose money. so its risky, but to be in then winning trade, you can follow some good strategy.  What is  "Best Nifty options to buy".  As per my view i will say, go for far options while buying, dont go for very near expiry. near expiry will be less costly, but very risky if trade goes against you.  Is it good to get "Nifty option trading tips" Getting tips from someone is not bad, but following that tip blindly is very risky, i suggest you to first learn and understand options. then do some practice with paper grades, then once you are confident, go...

Nifty option buying 10th October 2023

Image
 OPTION BUYING SETUP FOR OPTION BUYER SAFE OPTION TRADER OPTION BUYING SAFE SETUP NIFTY CHART FOR 10TH OCTOBER 2023 CALL BUYING STRIKE PRICE 19600 PUT OPTION BUYING STRIKE PRICE 19550 SEE THE CHART BELOW CALL OPTION CHART 19600 BUYING CAME WHEN FIRST CANDLE HIGH GOT CROSSED AND LOOK AT VOLUME, ITS VERY HIGH VOLUME, SUPPORT WAS 195 STOP LOSS WAS 165 AND TARGET ACHIEVED WAS 270. BUT IN THE CHART YOU CAN SEE SELL VOLUME NEVER CAME IN BIG VOLUME CANDLE. ALSO SEE PUT STRIKE CHART 19550 STRIKE PRICE CHART. BUYING NEVER CAME IN PUT SIDE. NO BUYING VOLUME IS SEEN ON PUT CHART. PLEASE NOTE, BEFORE READING AND SEEING THIS STRATEGY, MAKE SURE THIS IS JUST FOR EDUCATION PURPOSE. I AM NOT SEBI REGISTERED. IT’S NOT CALL OR PUT BUYING ADVISE.  I AM JUST SHARING MY VIEW. IF YOU LIKE IT. YOU CAN FOLLOW. PLEASE BACK TEST AND DO YOUR OWN RESEARCH, BEFORE ENTERING REAL TRADE. OPTION IS VERY RISKY, SO DON’T FOLLOW ANYONE, BLINDLY. DO FULL PRACTICE AND KEEP PROPER STOPLOSS AS PER YOUR RISK.

nifty option buying 11th October

Image
 Buying nifty option Safe strategy for option buyer nifty spot chart for 11th October call option buying strike price 19800 put option strike price 19750 see the strike price chart below call option 19800 strike price chart second  candle crossed high of first with good volume, buying came in 2nd candle with stop loss of 161 after that much volume was not seen, you can trail stop loss it reached till 211, you can exit at 190 to 200. it was not a big move, but less volume confirms its no trading day.  also see put option chart 19750 strike price chart there was no buying in put option. market traded in between top and bottom till end. PLEASE NOTE, BEFORE READING AND SEEING THIS STRATEGY, MAKE SURE THIS IS JUST FOR EDUCATION PURPOSE. I AM NOT SEBI REGISTERED. IT’S NOT CALL OR PUT BUYING ADVISE.  I AM JUST SHARING MY VIEW. IF YOU LIKE IT. YOU CAN FOLLOW. PLEASE BACK TEST AND DO YOUR OWN RESEARCH, BEFORE ENTERING REAL TRADE. OPTION IS VERY RISKY, SO DON’T FOLLOW ANYONE, ...

NIFTY OPTION BUYING FOR 12TH OCTOBER

Image
SAFE STRATEGY FOR NIFTY OPTION BUYERS NIFTY SPOT CHART FOR 12TH OCTOBER 2023. CALL BUYING STRIKE PRICE 19850 AND PUT BUYING STRIKE PRICE 19800   see the chart below for 19850 buying is 165 and high is 174. so approx 10 points.  in this case, let the premium cross 174 with good volume, or else dont enter the trade.in the volume chart there is no volume at all. now in put chart for 19800 you can see 123 is low, so you can buy at 123 if there is volume for buying, here stop loss is 113. so if you enter here, you target can be  139, it reached till 152. but there was no volume so we exit fast, in option buying dont buy if there is not much scope of big target, or else if you enter the trade, exit fast, if volume is missing. PLEASE NOTE, BEFORE READING AND SEEING THIS STRATEGY, MAKE SURE THIS IS JUST FOR EDUCATION PURPOSE. I AM NOT SEBI REGISTERED. IT’S NOT CALL OR PUT BUYING ADVISE.  I AM JUST SHARING MY VIEW. IF YOU LIKE IT. YOU CAN FOLLOW. PLEASE BACK TEST AND DO YOUR ...

nifty option buying setup with low volume on 13th October

Image
NIFTY OPTION BUYERS WILL LIKE THIS SETUP VERY STRANGE NIFTY SETUP. BUY ONLY WHERE YOU GET EXACT BUYING INDICATION. WAIT TILL THIS TYPE SETUP GET FORMED. 13TH OCTOBER NIFTY SETUP WAS VERY DIFFERENT FROM REGULAR BUYING SETUP. IN THIS CHART OF NIFTY SPOT  CALL OPTION 19700 AND PUT OPTION 19650  SEE BELOW CALL STRIKE PRICE CHART OF 19700. IN MOST CASES WE SEE, THAT WHEN LOW OF FIRST CANDLE IS CROSSED IN UPWARD DIRECTION, THERE IS A BIG VOLUME CANDLE, BUT IN THIS CASE, VOLUME WAS THERE, BUT VERY SMALL VOLUME COMPARED TO FIRST CANDLE. MAYBE THIS IS BECAUSE WE ARE SEEING MONTHLY OPTION CHART.  ALSO SEE CHART OF PUT STRIKE PRICE 19650. HERE YOU CAN SEE BUYING IS AT 114. WHILE BUYING CAME AT 114 , THE VOLUME WAS VERY LOW, SO WE IGNORED. HERE THE VOLUME PROCESS OF BUYING WORKED PROPERLY. PLEASE NOTE, BEFORE READING AND SEEING THIS STRATEGY, MAKE SURE THIS IS JUST FOR EDUCATION PURPOSE. I AM NOT SEBI REGISTERED. IT’S NOT CALL OR PUT BUYING ADVISE.  I AM JUST SHARING MY VIEW. IF...

NIFTY OPTION BUYING STRATEGY 16TH OCTOBER

Image
 NIFTY OPTION BUYING Here we are buying call or put for intraday, but our view is on monthly expiry.  now here we will share nifty spot chart of 16th October for trading view. we selected strike price as per first 5 min candle high and low. call strike price 19750 and put strike price 19700 now see call strike price chart below 19750 here buying is at 112 and stop loss is 100. keep eye on volume, we need volume to enter in any trade, let it be call or put. positive buying volume is good indication to enter rade. 2nd candel itself gave good volume.  because the 1st candel volume is still the big, we will enter the trade with proper caution, we entered at 120, with sl of 100 and in our mind we have target od 157. but we will exit at 150, if no big volume is seen. exactly at 157 we saw volume but it was not very big. so we exit at 150. and now wait for another setup. if we get big volume bar and that was not seen at all, so no entry. approx 30 points we made in nifty its lik...

NIFTY 17TH OCTOBER OPTION BUYING SETUP

Image
 OPTION BUYING SETUP FOR NIFTY OPTION BUYERS 17TH OCTOBER NIFTY CHART. NOW WHEN YOU SEE THIS DAY CHART OF 17TH OCTOBER, YOU WILL NEVER BUY OPTIONS ON THIS DAY, AS YOU CAN CLEARLY SAY, ITS RANGE BOUND DAY AND COMPLETELY DOMINATED BY SELLERS.  BUT HOW YOU CAN PREDICT THIS WITH FIRST CANDLE IN THE MARKET. ALSO YOU can see that first candle is very big red candle, you will get tempted to buy put options and this is trap by option sellers, retail traders loose lot of money on such days, this is due to time decay.  now when you see strike price chart, this will help you. also volume plays important role here. as per 1st 5 min candle. call strike is 19850  and put strike price is 19800 now see 19850 chart below buying at 102 and stop loss at 90. here you can see 1st candle high is 117. so difference is just 15 points. so instead of buying at 102 wait for volume to form, then enter the trade. you will see it went till 122 and then again came down and sl got hit. so instead o...

NIFTY OPTION BUYING 18TH OCTOBER 2023

Image
 NIFTY OPTION BUYING, VERY INTERESTING SETUP HOW TO SELECT EXACT STRIKE PRICE TO BUY 18TH OCTOBER NIFTY SPOT CHART SEE THE TRADING VIEW CHART NOW 1ST CANDLE HIGH IS 19825 AND LOW IS 19778 SO HERE COMES CONFUSION WHICH STRIKE PRICE TO SELECT. NOW 4 STRIKE PRICE COMES IN PLAY HERE. FOR CALL 19800 AND 19850 FOR PUT    19800 AND 19750 SO IN SUCH CASES VOLUME PLAYS BIG ROLE AND 1ST 5 MIN CANDLE DISTANCE PLAY BIG ROLE. IN STRIKE PRICE CHART. YOU SHOULD GO WITH VOLUME, AND KEEP EYE ON SPOT CHART.  NOW FIRST I WILL SHARE CALL STRIKE PRICE CHART 19800 CALL OPTION OCTOBER MONTH CHART BUYING AT 107 AND STOP LOSS AT 97. BUT SEE THE VOLUME, THERE IS NO POSITIVE VOLUME FOR BUYING,  STILL IF YOU BUY 10 POINT STOP LOSS HIT.  FOR 107 IF YOU BUY, IT WENT TILL 138, IF YOU ARE FAST SCALPER, YOU CAN PLAY, BUT I SUGGEST, DONT PRACTICE THAT, THIS WILL , THIS WILL DESTROY YOUR TRADING HABIT.  YOUR TRADING BEHAVIOR SHOULD BE VERY VERY SIMPLE AND NOT COMPLEX. BE SIMPLE, WAIT FO...

Nifty option buying 19th October 2023

Image
 NIFTY OPTION BUYING WITH STRATEGY NIFTY CALL AND PUT OPTION BUYING.  NIFTY SPOT CHART 19TH OCTOBER BUY CALL AT 19550 AND PUT AT 19550 BOTH STRIKE PRICE SAME. BUT WE WILL ALSO SEE WHAT HAPPENS IF WE GO ONE STRIKE FAR FOR BOTH CALL AND PUT CALL 19600 AND PUT 19500 NOW FIRST WE WILL SEE CALL STRIKE PRICE FOR BOTH 19550 AND 19600 CALL 19550 BUY AT 100 AND STOP LOSS 90 HERE BUYING NEVER CAME AT 100 AFTER 1ST CANDLE MISSED. IT CAME TILL 105, BUT AFTER THAT YOU CAN SEE VOLUME CAME AT THAT CANDLE  WAS  INDICATION TO BUY CALL. THAT CAN LOW WAS 116 AND HIGH WAS 130. SO IF YOU WAIT, BUYING CAME AT 116 LATER IN THE DAY, AND IT WENT TILL 179.  NOW SEE 19600 CALL STRIKE PRICE CHART NOW IN THIS STRIKE PRICE BUYING WAS 88 STOP LOSS WAS 78 AND TARGET WAS 131. BUT IN THIS STRIKE PRICE THE VOLUME INDICATION WHICH CAME IN 19550 WAS NOT SEEN, IT WAS THERE BUT NOT TOO MUCH BIG. SO INSTEAD OF BUYING OTM, IF YOU BUY ATM STRIKE PRICE ITS GOOD. AND ONCE YOU GET INDICATION FROM VOLUME, W...

nifty option buying 20th october

Image
 NIFTY OPTION BUYING NIFTY CHART FOR SPOT 20TH OCTOBER  CALL BUYING STRIKE PRICE 19550 AND PUT BUYING STRIKE PRICE 19500 CALL OPTION STRIKE PRICE CHART 19550 BUY AT 85 STOP LOSS AT 75 1ST TARGET IS 124 AND THEN TRAILING IF SETUP IS THERE. PUT OPTION STRIKE PRICE 19500 BUY AT 71 STOP LOSS AT 61 AND TARGET AT 92 AND IF IT GIVES BREAK OUT  THEN TRAILING THE TARGET WILL HELP. ON THIS DAY THERE WAS NO MOVEMENT AS YOU CAN SEE, ON PUT SIDE BASIC PROFIT OF 10 TO 15 POINTS AND ON CALL SIDE YOU GOT 5 TO 7 POINTS LOSS. PLEASE NOTE, BEFORE READING AND SEEING THIS STRATEGY, MAKE SURE THIS IS JUST FOR EDUCATION PURPOSE. I AM NOT SEBI REGISTERED. IT’S NOT CALL OR PUT BUYING ADVISE.  I AM JUST SHARING MY VIEW. IF YOU LIKE IT. YOU CAN FOLLOW. PLEASE BACK TEST AND DO YOUR OWN RESEARCH, BEFORE ENTERING REAL TRADE. OPTION IS VERY RISKY, SO DON’T FOLLOW ANYONE, BLINDLY. DO FULL PRACTICE AND KEEP PROPER STOPLOSS AS PER YOUR RISK.

nifty option buying 23rd october

Image
 Option buying strategy with plan nifty spot chart on 23rd October call buying 19550 and put buying 19500 call option chart nifty 19550 buying at 59 and stop loss at 49 put option strike price chart put 19500 buy at 69 and  stop loss 59. put side gave breakout at 94 with volume and it reached 282.  PLEASE NOTE, BEFORE READING AND SEEING THIS STRATEGY, MAKE SURE THIS IS JUST FOR EDUCATION PURPOSE. I AM NOT SEBI REGISTERED. IT’S NOT CALL OR PUT BUYING ADVISE.  I AM JUST SHARING MY VIEW. IF YOU LIKE IT. YOU CAN FOLLOW. PLEASE BACK TEST AND DO YOUR OWN RESEARCH, BEFORE ENTERING REAL TRADE. OPTION IS VERY RISKY, SO DON’T FOLLOW ANYONE, BLINDLY. DO FULL PRACTICE AND KEEP PROPER STOPLOSS AS PER YOUR RISK.

nifty option buying 25th October

Image
 option buying strategy first 5 min candle 19350 call and 19300 put call option chart call buy at 44 and stop loss 34 target trailing.  high is 66. once the target got achieved, but then stop loss hit. PUT OPTION CHART PUT buying at 48 and stop loss 38. buying came at 2nd and 9th candle . target of 100 achieved. but if trailing process followed then it went till 240. PLEASE NOTE, BEFORE READING AND SEEING THIS STRATEGY, MAKE SURE THIS IS JUST FOR EDUCATION PURPOSE. I AM NOT SEBI REGISTERED. IT’S NOT CALL OR PUT BUYING ADVISE.  I AM JUST SHARING MY VIEW. IF YOU LIKE IT. YOU CAN FOLLOW. PLEASE BACK TEST AND DO YOUR OWN RESEARCH, BEFORE ENTERING REAL TRADE. OPTION IS VERY RISKY, SO DON’T FOLLOW ANYONE, BLINDLY. DO FULL PRACTICE AND KEEP PROPER STOPLOSS AS PER YOUR RISK.

how to identify top and bottom in share market

 H ow to identify top and bottom in share market Is it possible to identify top and bottom in share market or in any market. Identifying the top and bottom in the stock market, also known as market timing, is a challenging task and even seasoned professionals struggle with it. It's important to note that attempting to time the market can be risky and often leads to losses. It's generally recommended to focus on long-term investing and a diversified portfolio rather than trying to time market peaks and troughs. However, if you still want to explore this area, here are some strategies and tools that traders and investors use to identify potential market tops and bottoms: Technical Analysis: a. Moving Averages: Some investors use moving averages, such as the 50-day and 200-day moving averages, to identify trends and potential reversal points. b. Support and Resistance Levels: Analyze historical price levels where the stock or market has previously found support (bottom) or resista...

Very interesting nifty option buying setup . you will enjoy this type of setup

Image
  WHY TO BELIEVE IN YOUR SETUP WHILE BUYING OPTIONS. what a nifty option setup When you follow some strategy, make sure you believe in that strategy and follow it for its exact working. No strategy will work 100% , sometimes you will get small stop loss hit. but if you follow it properly, it will give big profits too. on 17th and 18th October 2023, you will see the best example of this on 17th SL got hit, but same strike on 18th October gave huge profit. see the nifty chart first and then strike price chart next  IN THE CHART BELOW, YOU WILL SEE 2 RED ARROWS. 1ST RED ARROW IS STARTING OF 17TH OCTOBER AND 2ND RED ARROW IS 18 OCTOBER STARTING. 1ST GREEN ARROW GAVE BUYING PUT OPTION, THEN STOP LOSS GOT HIT. BUT NEXT DAY ON 18TH THE MARKET GAVE BREAKOUT, YOU SEE THE NEXT GREEN CANDEL, YOU AGAIN BUY PUT AND THERE YOU GET BIG PROFIT.  ALSO SEE THE 9 DAY MOVING AVERAGE LINE AND YOU CAN FOLLOW THAT. FOR EXIT. SEE THE STRIKE PRICE CHART AND YOU WILL UNDERSTAND THIS STRATEGY NIFTY ...

19th October 2023 nifty option buying confirmation candle

Image
 NIFTY OPTION BUYING CANDLE WITH STRATEGY see the chart below. its a 15 min candle stick chart. 2nd green arrow gave you break out. this confirmed that today, market will go call side.  but the break out candle was bit big, so wait for setup to form. you can buy on that candle too. in the chart you can see, 2nd green arrow was buying amd the candle marked with red arrow is your exit, because huge momentum came, take benefit of that. not see monthly chart of October, in that buying ATM strike price. 19600 NIFTY CALL OPTION STRIKE PRICE CHART now in the chart you will see blue arrow, buying came at 10 o clock. it was 92. market gave momentum with big green candle. it was 129, take benefit of this and exit. approx 40 points.  market went till 140, but you exit at momentum, do trade again.  this is called over trading, dont do this.  BUYING NIFTY OPTION WITH STRATEGY. PLEASE NOTE, BEFORE READING AND SEEING THIS STRATEGY, MAKE SURE THIS IS JUST FOR EDUCATION PURPOSE....