SPINNING TOP CANDLE IN NIFTY SPOT CHART
SPINNING TOP CANDLE
A spinning top candle is a specific type of candlestick pattern that can appear on a financial chart, especially in the context of stock market analysis. This pattern is characterized by its shape, which resembles a spinning top.
In financial chart analysis, a spinning top candlestick has the following features:
Shape: It has a small body with upper and lower wicks, indicating that the opening and closing prices were close together.
Size: The body of the candle is smaller compared to the length of the wicks.
Upper and Lower Wicks: The candlestick will have visible wicks (shadows) both above and below the body. These represent the highest and lowest prices reached during the trading period.
The interpretation of a spinning top candle can vary based on the context in which it appears within a price chart:
Indecision: The spinning top pattern suggests indecision in the market. The price opened and closed close to each other, indicating a tug-of-war between buyers and sellers. This often occurs after a significant price movement or during times of market uncertainty.
Reversal Signal: In some cases, a spinning top appearing after a prolonged trend (either upward or downward) might indicate a potential trend reversal. If a spinning top forms after a strong uptrend or downtrend, traders might interpret it as a signal that the trend may be losing strength or reversing.
Lack of Conviction: Traders may see a spinning top as a signal to be cautious as it signifies uncertainty or lack of strong conviction among market participants.
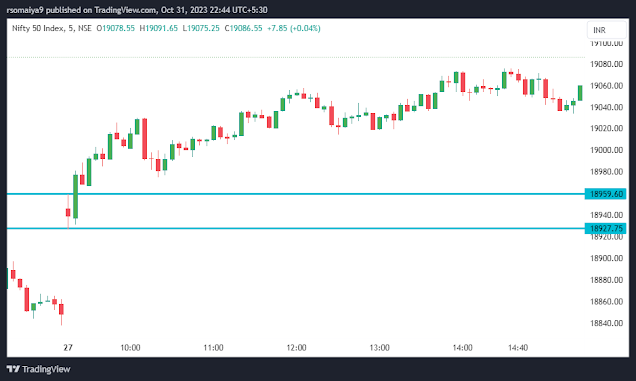
SEE THE EXAMPLE OF NIFTY SPOT CHART 27TH NOVEMBER
FIRST 5 MIN CANDLE IS SPINNING TOP. MARK HIGH LOW OF THIS CANDLE.
CALL STRIKE PRICE 18950 AND PUT STRIKE PRICE 18900
WE WILL BUY MONTHLY EXPIRY NOT WEEKLY EXPIRY
SEE THE PUT OPTION CHART
1ST 5 MIN HIGH AND LOW MARKED. NO VOLUME IS SEE AND MARKET TRADING BELOW LOW LINE. BUYING PUT OPTION NEVER CAME.

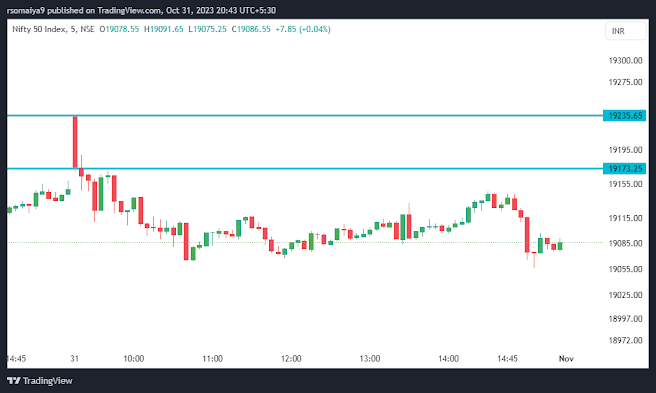
NOW SEE CALL OPTION CHART.
IN THIS CHART . MARK 1ST 5 MIN CANDEL HIGH LOW AND SEE IN CHART, THE 2ND CANDEL GAVE BUYING SIGNAL AND SEE VOLUME, IT WAS GOOD.
BUYING CAME AT 324 STOP LOSS 303 AND IT REACHED TILL 364 AND THEN NEXT 374

IN THE NIFTY CHART YOU WILL SEE THE SPINNING TOP CANDEL GOT BREAKOUT ON UPSIDE AND THIS GIVES GOOD SIGNAL.
PLEASE NOTE, BEFORE READING AND SEEING THIS STRATEGY, MAKE SURE THIS IS JUST FOR EDUCATION PURPOSE. I AM NOT SEBI REGISTERED. IT’S NOT CALL OR PUT BUYING ADVISE.
I AM JUST SHARING MY VIEW. IF YOU LIKE IT. YOU CAN FOLLOW. PLEASE BACK TEST AND DO YOUR OWN RESEARCH, BEFORE ENTERING REAL TRADE. OPTION IS VERY RISKY, SO DON’T FOLLOW ANYONE, BLINDLY. DO FULL PRACTICE AND KEEP PROPER STOPLOSS AS PER YOUR RISK.

Comments
Post a Comment