BREAKOUT STOCK " CDSL"
STOCK IS BREAKING THE RESISTANCE
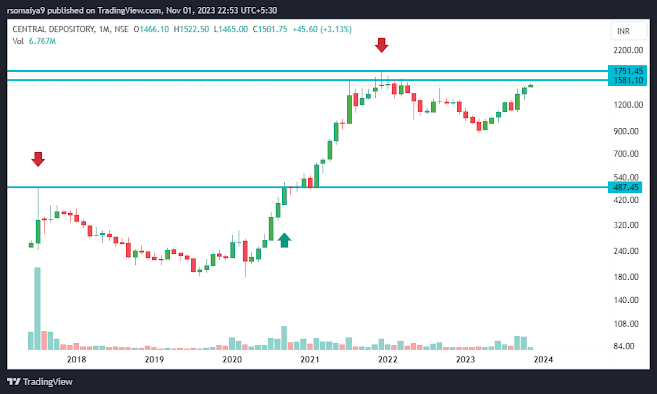
CDSL stock is on breakout line. its a monthly breakout.
see below spot chart of cdsl for you.
See the first red arrow. it has huge volume and stock started falling from there.
its a monthly chart and that is july 2017.
now on sep 2020 the stock gave breakout and it went up till 1751.
but the candel showing 1581 was main candle. now stock is trading at 1501. its quite possible that stock can reach 1751 and then consolidate for few days there and give breakout. because you can see positive volume generating there at that price. with small stoploss you can invest some money on this stock.
keep eye on this stock.
PLEASE NOTE, BEFORE READING AND SEEING THIS STRATEGY, MAKE SURE THIS IS JUST FOR EDUCATION PURPOSE. I AM NOT SEBI REGISTERED. IT’S NOT CALL OR PUT BUYING ADVISE.
I AM JUST SHARING MY VIEW. IF YOU LIKE IT. YOU CAN FOLLOW. PLEASE BACK TEST AND DO YOUR OWN RESEARCH, BEFORE ENTERING REAL TRADE. OPTION IS VERY RISKY, SO DON’T FOLLOW ANYONE, BLINDLY. DO FULL PRACTICE AND KEEP PROPER STOPLOSS AS PER YOUR RISK.

Comments
Post a Comment