Posts

Positive Breakouts Stocks: Angel One Stock Gave 50 percent return in 1 month

Image
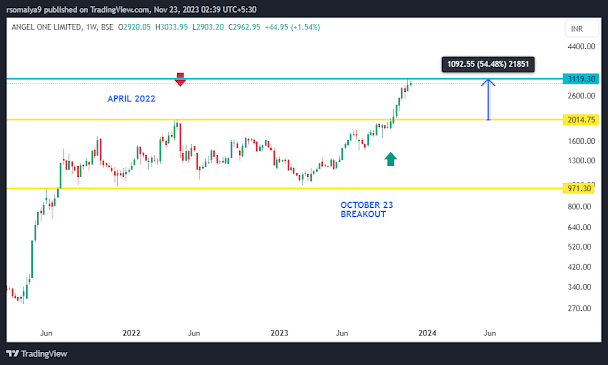
 POSITIVE BREAKOUT STOCK SUGGESTION ANGEL ONE stock gave 50 percent return in a month it was already suggested on October month. click the link below, to see what we suggested in October ANGEL ONE ON A BREAKOUT OCTOBER 2023 we are not SEBI registered adviser and this is not any buy or sell recommendation blog. we just shared our stock, and this stock gave breakout and. if you need any advise on your personal stock of your choice, share in comment section.

THIS STOCK GAVE 4 TIMES RETURN IN 1 YEAR MULIBAGGER STOCK

Image
 MONEY MULTIPLIER STOCK Action construction Equipment ( ACE) This stock gave multibagger return in last one year.  the return was approx 4 times. Approx 400% return. see below in 2008 it made high and then started going down. then after 9 years it reached there again on 135. but your stop loss got hit. it exactly tested 33, where it made previous low or support. again in june 2021 it  gave breakout, it gave retest and then after breaking 201, it went till 850 and still trading there.  in percentage wise this 400 times return in approx 1 years time.  but make sure you always keep stop loss. first time when the breakout came, it was fake breakout, if you trade without stop loss then it can be very risky. so always keep stop loss and enter again if setup is formed.  this shows why stop loss is very important. PLEASE NOTE, BEFORE READING AND SEEING THIS STRATEGY, MAKE SURE THIS IS JUST FOR EDUCATION PURPOSE. I AM NOT SEBI REGISTERED. IT’S NOT  BUYING ADVISE.  I AM JUST SHARING MY VIEW. IF

DLF Stock is on breakout line

Image
 DLF CAN BE MULTIBAGGER  CROREPATI STOCK DLF is on breakout line. see the dlf chart below. its a monthly chart stock came down in 2009 and then its coming at that point after 14 years.   may 2009 it was on 424 then in 2021 it came there again, but was not able to break that level. now in 2023 april the breakout was successful. currently trading at 574. stop loss can be 350 and target can be 1200. and if 1200 breaks then we can see at that time too. but make sure, this is long term investing. its not intraday. one more thing, the volume is missing there, so make sure you trail your stop loss, it can be fake breakout. but if you notice big volume and stock is trading above that big volume price, then be in trade.  see i have marked the volume candle too. you should see that type of volume. so be cautious, dont just blindly invest. the stock is good and its on breakout. but invest wisely. PLEASE NOTE, BEFORE READING AND SEEING THIS STRATEGY, MAKE SURE THIS IS JUST FOR EDUCATION PURPOSE. I

BREAKOUT STOCK " CDSL"

Image
 STOCK IS BREAKING THE RESISTANCE CDSL stock is on breakout line. its a monthly breakout. see below spot chart of cdsl for you. See the first red arrow. it has huge volume and stock started falling from there.  its a monthly chart and that is july 2017. now on sep 2020 the stock gave breakout and it went up till 1751. but the candel showing 1581 was main candle. now stock is trading at 1501. its quite possible that stock can reach 1751 and then consolidate for few days there and give breakout. because you can see positive volume generating there at that price. with small stoploss you can invest some money on this stock. keep eye on this stock. PLEASE NOTE, BEFORE READING AND SEEING THIS STRATEGY, MAKE SURE THIS IS JUST FOR EDUCATION PURPOSE. I AM NOT SEBI REGISTERED. IT’S NOT CALL OR PUT BUYING ADVISE.  I AM JUST SHARING MY VIEW. IF YOU LIKE IT. YOU CAN FOLLOW. PLEASE BACK TEST AND DO YOUR OWN RESEARCH, BEFORE ENTERING REAL TRADE. OPTION IS VERY RISKY, SO DON’T FOLLOW ANYONE, BLINDLY.

SPINNING TOP CANDLE IN NIFTY SPOT CHART

Image
 SPINNING TOP CANDLE WHAT IS SPINNING TOP CANDLE AND WHAT TO DO WHEN YOU SEE THIS CANDLE.  HERE IN THIS ARTICLE WE WILL SHARE DETAILS OF SPINNING TOP CANDLE ON NIFTY SPOT CHART, THIS WILL HELP US IN BUYING OPTIONS. A spinning top candle is a specific type of candlestick pattern that can appear on a financial chart, especially in the context of stock market analysis. This pattern is characterized by its shape, which resembles a spinning top. In financial chart analysis, a spinning top candlestick has the following features: Shape: It has a small body with upper and lower wicks, indicating that the opening and closing prices were close together. Size: The body of the candle is smaller compared to the length of the wicks. Upper and Lower Wicks: The candlestick will have visible wicks (shadows) both above and below the body. These represent the highest and lowest prices reached during the trading period. The interpretation of a spinning top candle can vary based on the context in which it

"NIFTY FAKE BREAKDOWN" REAL EXAMPLE

Image
 WHAT IS FAKE BREAK DOWN IN OPTION BUYING WHERE IT OCCURS AND HOW IT OCCURS Support and Resistance Levels:  Fluctuations around key support or resistance levels that initially indicate a breakdown but may not sustain. Market Manipulation:  Instances where market actors may attempt to deceive traders by creating false breakdown patterns. Whipsaw Movement:  Rapid price movements that falsely suggest a trend reversal, often leading to sudden reversals. Liquidity Issues:  Temporary lack of liquidity causing price movements that might resemble a breakdown but later revert. Market Sentiment:  Sudden shifts in market sentiment causing apparent breakdowns that don't continue. Option Expiry:  False breakdowns close to option expiry dates used to manipulate options prices. Technical Indicators:  Misleading signals from technical indicators like RSI, MACD, or Moving Averages, indicating a breakdown that fails to materialize. News or Events:  Immediate market reactions to news or events that l

Best "Nifty option strategies" For buying "Intraday Nifty options"

Image
 "Nifty option strategies" As you all know, we are here to discuss about nifty option buying. we focus on buying option and not selling. option selling is considered is safe trade buy its very costly and required big capital to trade.  but for option buying, the capital required is very less, and if you practice hard then there are good chances to succeed in nifty option buying too. Its said 9 out of 10 buyers loose money. so its risky, but to be in then winning trade, you can follow some good strategy.  What is  "Best Nifty options to buy".  As per my view i will say, go for far options while buying, dont go for very near expiry. near expiry will be less costly, but very risky if trade goes against you.  Is it good to get "Nifty option trading tips" Getting tips from someone is not bad, but following that tip blindly is very risky, i suggest you to first learn and understand options. then do some practice with paper grades, then once you are confident, go